Airports by FAA Enplanement Rank | Airside Maps
Lists the 50 airports that have a guide on this site, sorted by preliminary CY2025 enplanements (one-way boardings), FAA rank order from Wikipedia, sourced from FAA Preliminary CY2025 Enplanements at All Commercial Service Airports (by Rank) (data as of 2026-08-03).
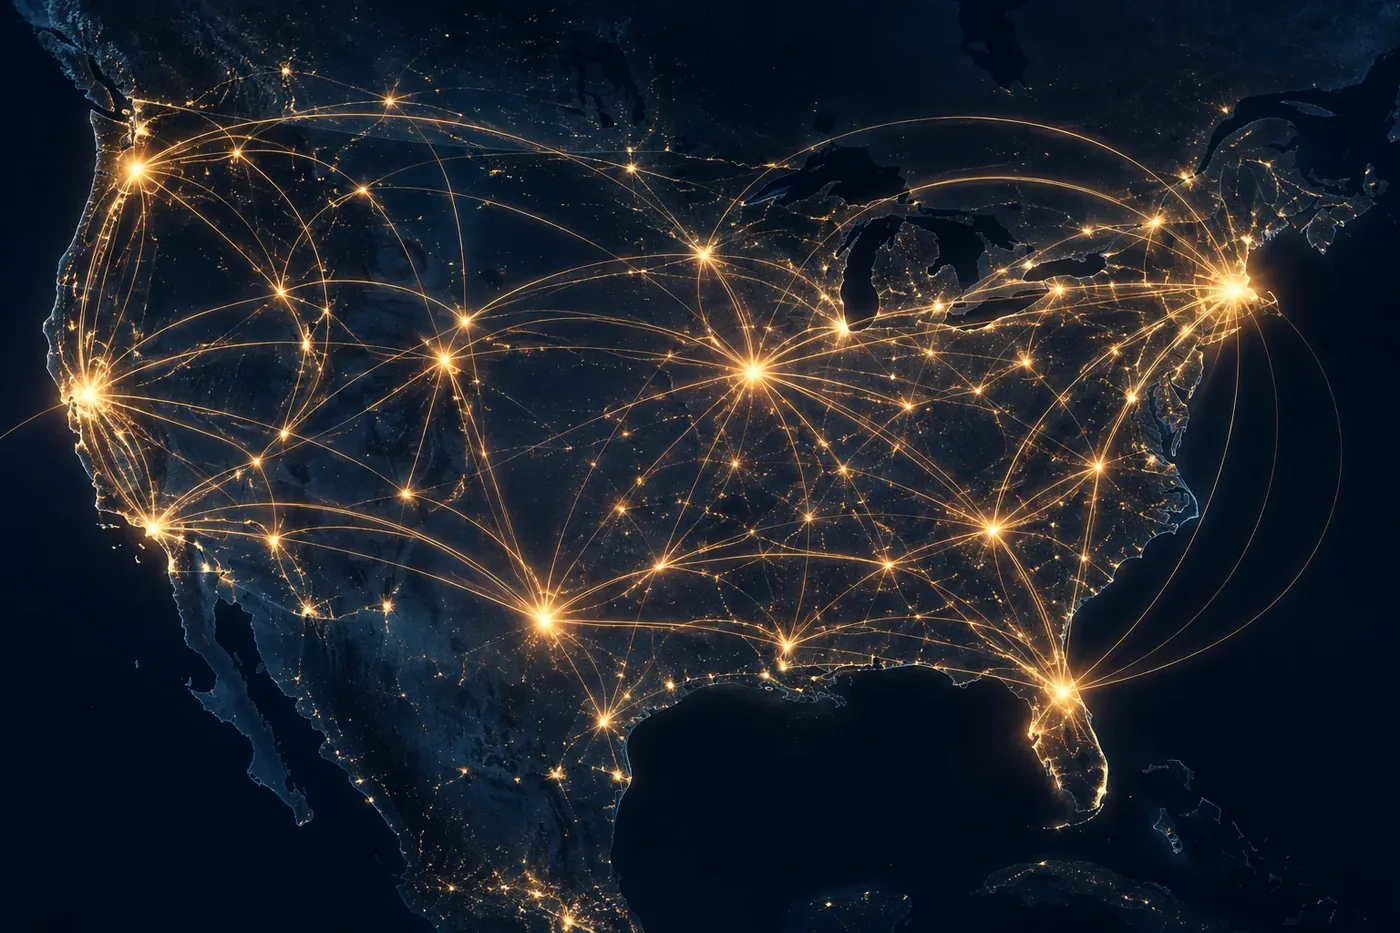
50 airports. Combined CY2025 enplanements 786,323,190. Highest ATL at 51,459,786; lowest BUF at 2,533,180. Median 12,411,719. Site rank is the rank value in the site's airport data file; FAA rank is the rank in the FAA table. See the same 50 airports grouped by state →
Ranked table
| IATA | Airport | City, State | Site rank | FAA rank | CY2025 enplanements | Share of listed total |
|---|---|---|---|---|---|---|
| ATL | Hartsfield-Jackson Atlanta International Airport | Atlanta, GA | 1 | 1 | 51,459,786 | 6.5% |
| DFW | Dallas/Fort Worth International Airport | Dallas-Fort Worth, TX | 9 | 2 | 41,297,009 | 5.3% |
| ORD | O'Hare International Airport | Chicago, IL | 3 | 3 | 40,680,735 | 5.2% |
| DEN | Denver International Airport | Denver, CO | 4 | 4 | 39,976,695 | 5.1% |
| LAX | Los Angeles International Airport | Los Angeles, CA | 2 | 5 | 36,497,303 | 4.6% |
| JFK | John F. Kennedy International Airport | New York, NY | 5 | 6 | 30,792,806 | 3.9% |
| MCO | Orlando International Airport | Orlando, FL | 7 | 7 | 27,999,709 | 3.6% |
| LAS | Harry Reid International Airport | Las Vegas, NV | 8 | 8 | 26,531,765 | 3.4% |
| MIA | Miami International Airport | Miami, FL | 11 | 9 | 26,450,972 | 3.4% |
| SFO | San Francisco International Airport | San Francisco, CA | 13 | 10 | 26,251,850 | 3.3% |
| CLT | Charlotte Douglas International Airport | Charlotte, NC | 6 | 11 | 25,873,555 | 3.3% |
| SEA | Seattle-Tacoma International Airport | Seattle, WA | 10 | 12 | 25,417,071 | 3.2% |
| PHX | Phoenix Sky Harbor International Airport | Phoenix, AZ | 12 | 13 | 25,094,817 | 3.2% |
| EWR | Newark Liberty International Airport | Newark, NJ | 14 | 14 | 23,464,492 | 3.0% |
| IAH | George Bush Intercontinental Airport | Houston, TX | 20 | 15 | 23,265,028 | 3.0% |
| BOS | Boston Logan International Airport | Boston, MA | 16 | 16 | 21,021,153 | 2.7% |
| MSP | Minneapolis-Saint Paul International Airport | Minneapolis, MN | 15 | 17 | 17,488,261 | 2.2% |
| DTW | Detroit Metropolitan Wayne County Airport | Detroit, MI | 18 | 18 | 16,294,768 | 2.1% |
| LGA | LaGuardia Airport | New York, NY | 19 | 19 | 16,278,532 | 2.1% |
| FLL | Fort Lauderdale-Hollywood International Airport | Fort Lauderdale, FL | 17 | 20 | 15,646,752 | 2.0% |
| PHL | Philadelphia International Airport | Philadelphia, PA | 21 | 21 | 14,779,849 | 1.9% |
| IAD | Washington Dulles International Airport | Washington | 22 | 22 | 13,859,569 | 1.8% |
| SLC | Salt Lake City International Airport | Salt Lake City, UT | 23 | 23 | 13,429,096 | 1.7% |
| SAN | San Diego International Airport | San Diego, CA | 26 | 24 | 12,675,684 | 1.6% |
| BNA | Nashville International Airport | Nashville, TN | 30 | 25 | 12,549,304 | 1.6% |
| BWI | Baltimore/Washington International Thurgood Marshall Airport | Baltimore, MD | 25 | 26 | 12,274,134 | 1.6% |
| TPA | Tampa International Airport | Tampa, FL | 28 | 27 | 12,110,427 | 1.5% |
| DCA | Ronald Reagan Washington National Airport | Arlington, VA | 24 | 28 | 12,003,594 | 1.5% |
| AUS | Austin-Bergstrom International Airport | Austin, TX | 29 | 29 | 10,651,727 | 1.4% |
| HNL | Daniel K. Inouye International Airport | Honolulu, HI | 33 | 30 | 10,430,353 | 1.3% |
| MDW | Chicago Midway International Airport | Chicago, IL | 27 | 31 | 9,367,712 | 1.2% |
| PDX | Portland International Airport | Portland, OR | 32 | 32 | 9,054,394 | 1.2% |
| RDU | Raleigh-Durham International Airport | Raleigh, NC | 38 | 34 | 7,670,956 | 1.0% |
| STL | St. Louis Lambert International Airport | St. Louis, MO | 35 | 35 | 7,483,526 | 1.0% |
| SMF | Sacramento International Airport | Sacramento, CA | 40 | 36 | 6,805,910 | 0.9% |
| MSY | Louis Armstrong New Orleans International Airport | New Orleans, LA | 37 | 39 | 6,221,146 | 0.8% |
| MCI | Kansas City International Airport | Kansas City, MO | 31 | 40 | 5,613,974 | 0.7% |
| RSW | Southwest Florida International Airport | Fort Myers, FL | 41 | 42 | 5,504,420 | 0.7% |
| SJC | San Jose International Airport | San Jose, CA | 39 | 43 | 5,257,421 | 0.7% |
| IND | Indianapolis International Airport | Indianapolis, IN | 43 | 45 | 5,221,447 | 0.7% |
| CLE | Cleveland Hopkins International Airport | Cleveland, OH | 44 | 46 | 4,855,943 | 0.6% |
| PIT | Pittsburgh International Airport | Pittsburgh, PA | 45 | 47 | 4,792,035 | 0.6% |
| OAK | Oakland International Airport | Oakland, CA | 36 | 48 | 4,532,494 | 0.6% |
| CMH | John Glenn Columbus International Airport | Columbus, OH | 42 | 49 | 4,396,625 | 0.6% |
| JAX | Jacksonville International Airport | Jacksonville, FL | 47 | 52 | 3,719,723 | 0.5% |
| MKE | Milwaukee Mitchell International Airport | Milwaukee, WI | 46 | 58 | 2,889,040 | 0.4% |
| ANC | Ted Stevens Anchorage International Airport | Anchorage, AK | 49 | 59 | 2,729,285 | 0.3% |
| OMA | Eppley Airfield | Omaha, NE | 50 | 61 | 2,565,135 | 0.3% |
| ABQ | Albuquerque International Sunport | Albuquerque, NM | 51 | 62 | 2,562,028 | 0.3% |
| BUF | Buffalo Niagara International Airport | Buffalo, NY | 48 | 63 | 2,533,180 | 0.3% |